Data Visualization Market Size, Share, Trends and Growth Report – Global Opportunities & Forecast, 2023-2030
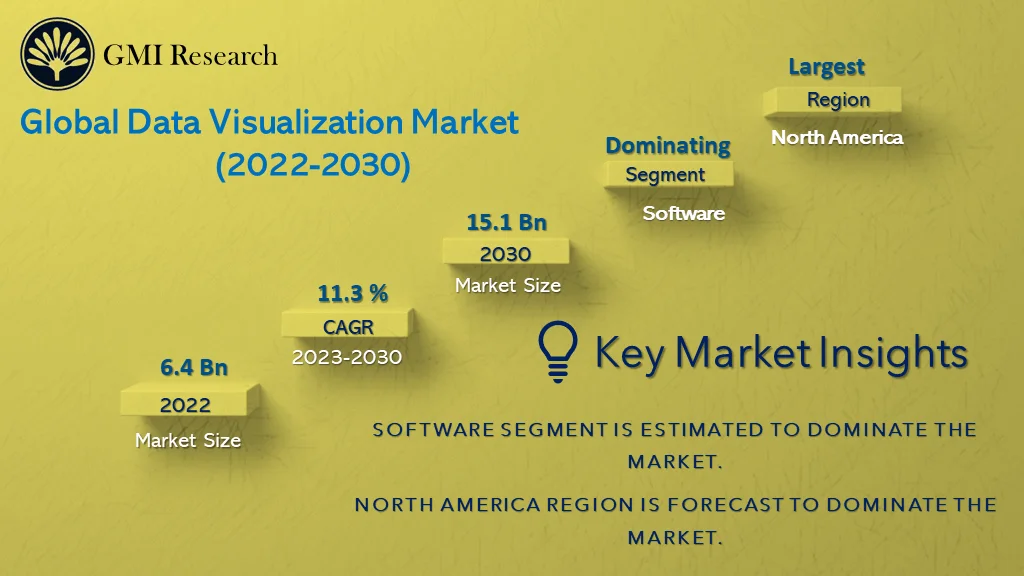
Analysis from GMI Research finds that the Data Visualization Market earned revenues of USD 6.4 billion in 2022 and forecast to touch USD 15.1 billion in 2030 will grow at a CAGR of 11.3% from 2023-2030.
Overview of the Data Visualization Market Report
Data visualization refers to the representation of information and data with the help of a variety of different graphs and tables including infographics, heatmap visualization, fever charts, area charts, and histogram among other data visualization tools. Data visualization help organizations in decision-making process by detecting patterns, trends, and correlation between different data sets.
To have an edge over the competition by knowing the market dynamics and current trends of “Data Visualization Market”, request for Sample Report here
Market Dynamic
Key Drivers and Emerging Trends
Rapid developments in the field of big data and the emerging demand for predictive analysis & rapid decision making, and easy access to visualization by multi-device such as mobile, desktop, and laptops are some of the prominent factors that are expected to boost the growth of the data visualization market share. In addition, adoption of the Internet of Things (IoT) and artificial intelligence (AI) technologies are likely to increase both unstructured and structured data, thereby creating lucrative growth opportunities for the market over the forecast period. Moreover, the growing adoption of visual analytics and scientific visualization of data by small, medium, and large enterprises for identifying the inter-relation between multi-dimensional sets of data and analysing massive amounts of information to make data-driven decisions is expected to further fuel the data visualization market growth.
Restraint in the Data Visualization Market
As per the data visualization market landscape report, the high cost of installing visualization tools and platforms may hamper the adoption of data visualization software by small and medium enterprises. Additionally, the complexity of support services including maintenance and staff training and the lack of centralized data security is further expected to restraint the data visualization market size.
Do you want to know more about the Research process and detailed Methodology, Request Research Methodology of this report
Component – Segment Analysis
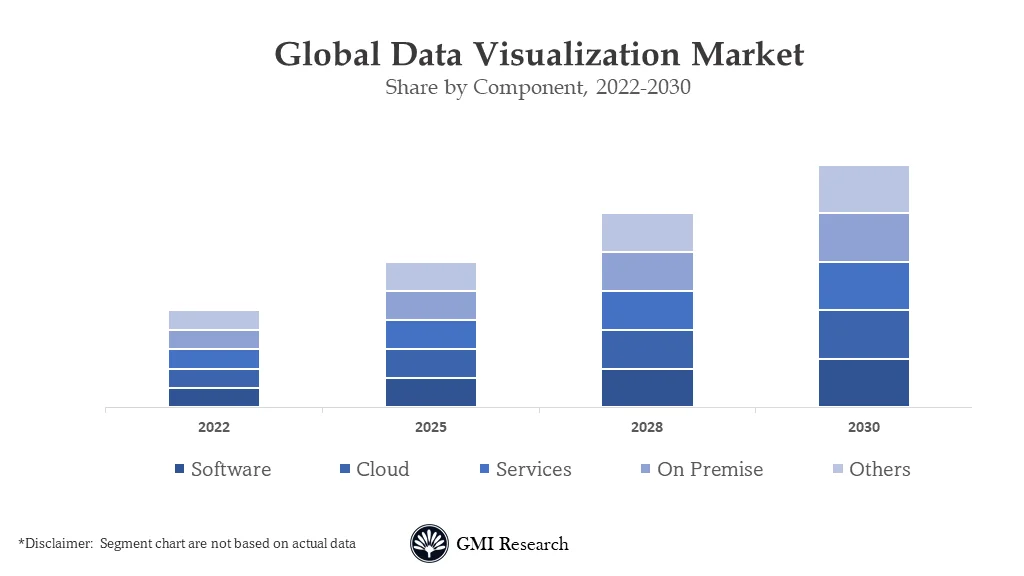
Based on component, the software segment is expected to account for a larger share in the market primarily due to the rising adoption of business intelligence (BI) tools including Microsoft Power BI, Tableau, IBM Cognos Analytics, QlikView, Qlik Sense, Looker, and Sisense by organizations to evaluate data and create visualizations for business prediction and decision making.
Solution – Segment Analysis
Based on solution, the embedded data visualization module solution is anticipated to grow at a higher CAGR in the market. This can be attributed to its easy, time efficient, and inexpensive development and user-friendly interface. Embedded data visualization provides software with capabilities including data visualization, analytics, dashboards, and reporting. This is further supporting the market growth over the forecast period.
Enterprise Size – Segment Analysis
Based on the enterprise size, medium enterprises segment is projected to grow at a faster CAGR during the forecast period owing to the growing demand of visualization tools for improving profit and better decision making, availability of paid as well as free versions of data visualization software, and increasing number of medium sized business globally. According to the World Bank Group, small and medium enterprises represent about 90% of businesses worldwide and estimated to provide 600 million jobs 2030.
Industry – Segment Analysis
Based on industry, healthcare and pharmaceuticals is anticipated to grow at a significant CAGR during the forecast period owing to the several benefits offered by data visualization tools which includes its ability to enhance reporting and data analysis of patients history, add valuable insights into the hospital’s commercial efficiency, and the trends of patient satisfaction scores, among others. Various data visualization tools such as Tableau’s COVID-19 Coronavirus Data Hub, John Hopkins University Dashboard, and WHO COVID- 19 dashboard have been developed during the outbreak of COVID 19 pandemic for real-time updates and trends pertaining coronavirus.
In case, any of your pain points areas are not covered in the current scope of this report, Request for Free Customization here
Regional – Segment Analysis
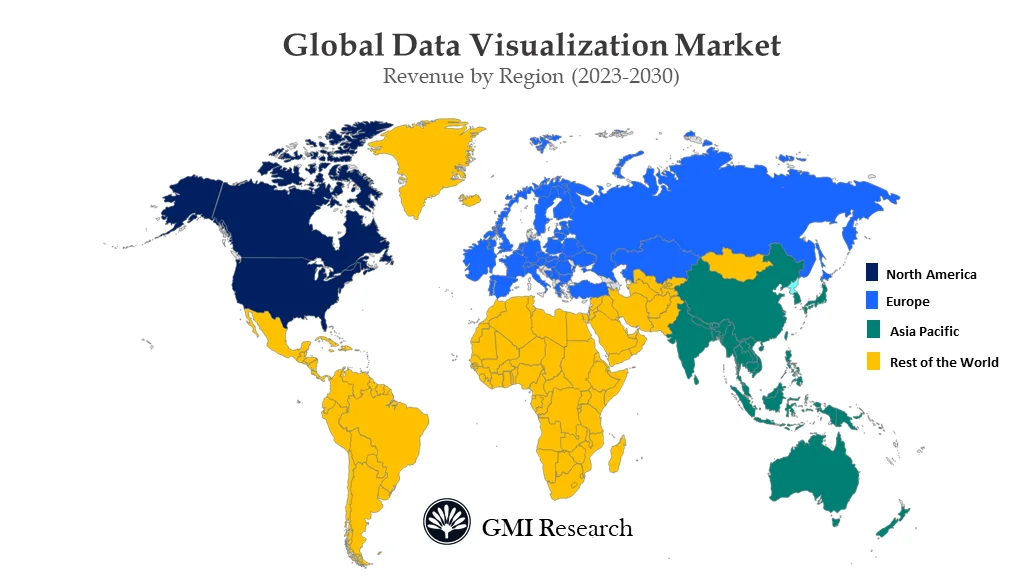
Based on region, North America is expected to witness faster CAGR in the global data visualization market over the forecast period owing to the rapid economic development, presence of large number of industries including healthcare, retail, consumer goods, BFSI, and logistics, together with huge expenditure of enterprises on information visualization and analytics tools in the region. Moreover, the strong presence of leading players including Alphabet, Inc., Microsoft Corporation, International Business Machines Corporation, and Oracle Corporation in the region is further accelerating the market growth.
Top Market Players
Several Leading players operating in the market include QlikTech International AB, Alphabet, Inc., Salesforce.com, Inc., Microsoft Corporation, SAS Institute Inc., SAP SE, Oracle Corporation, International Business Machines Corporation, Sisense Inc., and Tableau Software LLC, among others.
Key Developments:
-
- In 2020, QlikTech International AB acquired RoxAI and its Ping intelligent alerting software. This acquisition enhanced analytics users’ and systems’ ability to proactively monitor and manage their business data in real-time to make faster, insight-driven decisions.
- In 2020, Google Cloud, a part of Alphabet, Inc., announced the acquisition of Looker, a business intelligence software and big data analytics platform. This expansion helped in enhancing the company’s portfolio in the data visualization segment.
Segments Covered in the Report:
The global data visualization market has been segmented on the basis of component, solution, enterprise size, industry, and regions. Based on component, the market is segmented into software and services. Based on solution, the market is segmented into standalone visualization software and embedded data visualization module. Based on enterprise size, the market is segmented into small enterprises, medium enterprises, and large enterprises. Based on industry, the market is segmented into BFSI, construction and real estate, consumer goods, education, government, healthcare and pharmaceuticals, information technology, services, and telecommunications, research, retail and e-commerce, transportation and logistics, and others.
For detailed scope of the “Data Visualization Market” report request a Sample Copy of the report
Key questions answered in this research report:
-
- At what pace is global Data Visualization Market growing? What will be the growth trend in the future?
- What are the key drivers and restraints in Data Visualization Market? What will be the impact of drivers and restraints in the future?
- What are the regional revenues and forecast breakdowns? Which are the major regional revenue pockets for growth in the global Data Visualization Market?
- Which component generated maximum revenues in 2019 and identify the most promising component during the forecast period?
- What are the various industries of global Data Visualization Market and how they are poised to grow?
- What companies are the major participants in this market and their business strategies, how does the competitive landscape look like?
|
Report Coverage |
Details |
| Market Revenues (2022) |
USD 6.4 billion |
| Market Base Year |
2022 |
| Market Forecast Period |
2023-2030 |
| Base Year & Forecast Units |
Revenues (USD Billion) |
| Market Segment | By Component, By Solution, By Enterprise Size, By Industry, By Region |
| Regional Coverage | Asia Pacific, Europe, North America, and RoW |
| Companies Profiled | QlikTech International AB, Alphabet, Inc., Salesforce.com, Inc., Microsoft Corporation, SAS Institute Inc., SAP SE, Oracle Corporation, International Business Machines Corporation, Sisense Inc., and Tableau Software LLC, among others; a total of 10 companies covered. |
| 25% Free Customization Available | We will customize this report up to 25% as a free customization to address our client’s specific requirements |
Market Segmentation
Global Data Visualization Market by Component
-
- Software
- On Premise
- Cloud
- Services
- Consulting Services
- Support Services
Global Data Visualization Market by Solution
-
- Standalone Visualization Software
- Embedded Data Visualization Module
Global Data Visualization Market by Enterprise Size
-
- Small Enterprises
- Medium Enterprises
- Large Enterprises
Global Data Visualization Market by Industry
-
- BFSI
- Construction and Real Estate
- Consumer Goods
- Education
- Government
- Healthcare and Pharmaceutical
- Information Technology, Services, and Telecommunications
- Research
- Retail and E-commerce
- Transportation and Logistics
- Others
Global Data Visualization Market by Region
-
-
North America Data Visualization Market (Option 1: As a part of the free 25% customization)
- By Component
- By Solution
- By Enterprise Size
- By Industry
- US Market All-Up
- Canada Market All-Up
-
Europe Data Visualization Market (Option 2: As a part of the free 25% customization)
- By Component
- By Solution
- By Enterprise Size
- By Industry
- UK Market All-Up
- Germany Market All-Up
- France Market All-Up
- Spain Market All-Up
- Rest of Europe Market All-Up
-
Asia-Pacific Data Visualization Market (Option 3: As a part of the free 25% customization)
- By Component
- By Solution
- By Enterprise Size
- By Industry
- China Market All-Up
- India Market All-Up
- Japan Market All-Up
- Rest of APAC Market All-Up
-
RoW Data Visualization Market (Option 4: As a part of the free 25% customization)
- By Component
- By Solution
- By Enterprise Size
- By Industry
- Brazil Market All-Up
- South Africa Market All-Up
- Saudi Arabia Market All-Up
- UAE Market All-Up
- Rest of world (remaining countries of the LAMEA region) Market All-Up
-
Major Players Operating in the Data Visualization Market (Option 5: As a part of the Free 25% Customization – Profiles of 5 Additional Companies of your Choice)
-
- QlikTech International AB
- Alphabet, Inc.
- com, Inc.
- Microsoft Corporation
- SAS Institute Inc.
- SAP SE
- Oracle Corporation
- International Business Machines Corporation
- Sisense Inc.
- Tableau Software LLC
Frequently Asked Question About This Report
Data Visualization Market [UP2018-001001]
The software segment is expected to account for a larger share in the market primarily due to the rising adoption of business intelligence (BI) tools such as Microsoft Power BI, Tableau, IBM Cognos Analytics, and other by organizations to evaluate data and create visualizations for business prediction and decision making.
Rapid developments in the field of big data and the emerging demand for predictive analysis & rapid decision making, and easy access to visualization by multi-device such as mobile, desktop, and laptops are some of the prominent factors that are expected to boost the growth of the data visualization market share.
The Data Visualization Market is estimated to rise at USD 15.1 billion by 2030 at a CAGR of 11.3% over the forecast period.
The healthcare and pharmaceuticals are anticipated to grow at a significant CAGR during the forecast period owing to the several benefits offered by data visualization tools which includes its ability to enhance reporting and data analysis of patient’s history, add valuable insights into the hospital’s commercial efficiency, and the trends of patient satisfaction scores, among others.
- Published Date: Aug- 2022
- Report Format: Excel/PPT
- Report Code: UP2018-001001
Licensing Options
Single-User License:
The report is used by the purchaser (One Individual) only
Multi-User License:Report is shared with maximum 5 users (employees) including the purchaser of the purchasing corporation only
Corporate License:
Report is shared with unlimited user (employees) of the purchasing corporation only
The report is used by the purchaser (One Individual) only
Multi-User License:Report is shared with maximum 5 users (employees) including the purchaser of the purchasing corporation only
Corporate License:
Report is shared with unlimited user (employees) of the purchasing corporation only
Data Visualization Market Size, Share, Trends and Growth Report – Global Opportunities & Forecast, 2023-2030
$ 4,499.00 – $ 6,649.00
Why GMI Research
